See Steel, Torrie and Dickey, Chapters 11 and 14.
The association between 2 variables, or traits, can be measured by a regression coefficient, or by a correlation coefficient. We have looked at regression coefficients in the section Multiple Regression. Regression coefficients are appropriate when we consider that there is a cause-and-effect relationship, one trait (Y) is the dependent trait and the other trait(s) (the X's) are the explanitory (or independent) variables. Y is a function of the X's. There is no requirement that the X's be normally distributed; if you think that there is a cause-and-effect relation ship between the X's and Y then you should be computing a regression (multiple) and NOT a correlation!
A correlation between 2 variables/traits is another type of measure of association, but one where there is no implied cause-and-effect. There is no implication of an effect of X on Y, nor of Y on X, rather that there is simply an association, or correlation, between the 2 variables; presumably because they are both influenced by some other (hidden) factor and hence both vary together (to some extent; the measure of the extent being the correlation!).
It is important to note that a correlation should only be computed when the 2, or more, traits are both/all randomly sampled, such that a bivariate normal distribution is a valid assumption.
An example will illustrate this:
1) Suppose that we visit a dairy farmer and we want to examine the correlations between the milk yield, fat yield and protein yield in cows. We shall consider the 36 cows that the producer has to be a representative, random sample of cows. Then, if milk fat and protein yields are normally distributed, it will be a reasonable assumption that, between each pair of traits, we have a bivariate normal distribution. For each cow we record her milk yield and we take a milk sample which will be subsequently analysed for fat % and protein % in the milk analysis laboratory of PATLQ (Programme d'Analyse des Troupeaux Laitiers du Québec), the provincial dairy milk recording programme.
We obtain the following results:
| Cow Id | Milk Yield | Fat % | Protein % |
|---|---|---|---|
| 1 | 27.2 | 2.77 | 3.32 |
| 2 | 23.0 | 2.80 | 3.43 |
| 3 | 21.1 | 3.20 | 3.61 |
| 4 | 20.8 | 2.73 | 3.57 |
| 5 | 15.5 | 4.07 | 3.96 |
| 6 | 15.4 | 4.41 | 4.10 |
| 7 | 13.2 | 4.29 | 4.13 |
| 8 | 24.0 | 3.66 | 3.07 |
| 9 | 20.4 | 3.82 | 3.14 |
| 10 | 20.8 | 3.87 | 3.35 |
| 11 | 20.0 | 3.75 | 3.46 |
| 12 | 21.8 | 3.76 | 3.49 |
| 13 | 17.8 | 3.36 | 3.72 |
| 14 | 16.0 | 4.19 | 3.71 |
| 15 | 14.6 | 4.48 | 3.69 |
| 16 | 13.4 | 4.60 | 3.72 |
| 17 | 41.3 | 2.83 | 2.87 |
| 18 | 33.2 | 3.39 | 2.69 |
| 19 | 36.0 | 2.83 | 3.02 |
| 20 | 30.2 | 3.27 | 3.11 |
| 21 | 29.2 | 2.84 | 3.18 |
| 22 | 24.4 | 4.09 | 3.31 |
| 23 | 19.6 | 4.12 | 3.56 |
| 24 | 20.8 | 4.22 | 3.75 |
| 25 | 16.5 | 4.32 | 3.95 |
| 26 | 16.8 | 4.32 | 3.97 |
| 27 | 16.4 | 4.55 | 3.74 |
| 28 | 37.2 | 2.98 | 3.24 |
| 29 | 26.1 | 3.89 | 3.13 |
| 30 | 31.6 | 3.80 | 3.41 |
| 31 | 28.4 | 3.79 | 3.36 |
| 32 | 27.0 | 3.51 | 3.36 |
| 33 | 21.9 | 3.79 | 3.42 |
| 34 | 22.5 | 3.93 | 3.34 |
| 35 | 19.2 | 4.05 | 3.51 |
| 36 | 16.1 | 4.09 | 3.67 |
A suitable statistical model to describe each cow's milk yield would be: myi = µm + emi
A suitable statistical model to describe each cow's fat production would be: fi = µf + efi
A suitable statistical model to describe each cow's protein production would be: pi = µp + epi
Which we can re-write more succinctly as:
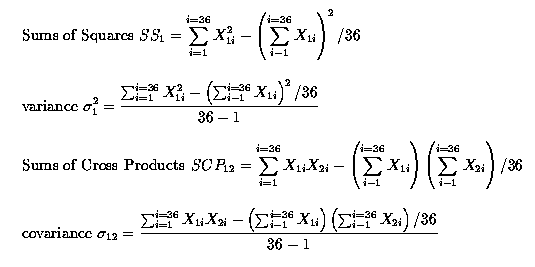
How do we compute the correlations?
1) By hand !! Ugh!

Note that when we compute the correlations, each observation Xij is effectively expressed as a deviation from the respective trait mean, µj. This means that we are computing the correlations amongst the e's! This point is often overlooked, AND IT IS VERY IMPORTANT.

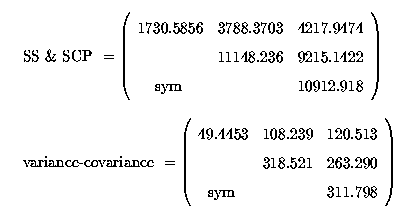
This gives us a matrix of variances and covariances, amongst the random error residuals:
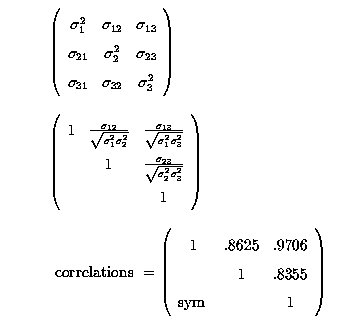
A correlation matrix is nothing more than the covariances scaled according to the variability of each trait, so that the correlation is unitless, or dimensionless.
Correlations range between -1 and +1. Thus, continuing with our 36 cows we get:

2) Using SAS! Youppie!
SAS statements

data milk1;
input cow my fpc ppc;
fy = my * fpc;
py = my * ppc;
cards;
- - - -
- - - -
;
proc corr data=milk1;
var my fy py;
run;
Rather than PROC CORR we could also use PROC GLM, in MANOVA (Multivariate Analysis of Variance) mode:
proc glm;
model my fy py = ;
manova /printe;
run;
Consider the following data relating to rainbow trout, their growth rate (X1), feed availability (X2), competition (X3), water temperature (X4) and size (X5) :
Correlations

      X1      X2       X3       X4       X5
 X1   1.0    .2206   -.3284   -.0910   -.2160
 X2          1.0      .6448   -.1566   -.1079
 X3                   1.0      .0240   -.2010
 X4   symmetric                1.0     -.7698
 X5                                     1.0
Compute the partial correlation between X1 and X2 adjusting for X3, X4 and X5, i.e. r12|345.
Compute the partial correlation between X1 and X2 adjusting for X3, i.e. r12|3.
How important is it? VERY!
My example of a group of 36 cows in a herd. if we consider that they are a random, representative sample of cows and not selected on anything related to milk, fat and/or protein, then, if milk, fat and protein are normally distributed, in our sample they will be normally distributed.
But suppose that our 36 cows were only a subsample from the farmer's herd. Imagine that the farmer had 80 cows and that for milk, fat and protein we have a normal distribution. If we had chosen the 36 cows to measure because they were the 36 above average cows for milk, fat and/or protein, or indeed, anything correlated to milk, fat and/or protein then our subsample would not have a normal distribution. So, for example, if bodyweight of the cow was correlated to milk, fat and/or protein and we selected the above (or below) average cows for bodyweight then it would be invalid, inappropriate and pointless to compute a correlation between milk, fat and protein.
We do not have the liberty to simply define our population as whatever we want. We cannot say that we are defining our population as being the 36 cows that we have that are above 6000 kg (mean) and that that is OK, and that milk, fat and protein will be normally distributed; they will not.
Often researchers learn about correlations using relatively simple examples, such as the ones given above. These examples include NO fixed effects in the model, only the mean for each trait (µtrait). Thus when the variances and covariances amongst traits are computed they are free of all fixed effects and we are only looking at the correlations amongst the residuals, which is therefore valid. But what if we have an experiment where there are fixed effects, such as different treatments, or male and female animals, etc? Then it is not valid to compute correlations (simple or partial) by simply using the observations as we have done before. Why? Because there are the presence of the fixed effects which we have to 'remove', so that we can correlate the residuals of each trait from each animal.
This sort of situation is very common. Consider the following example. We have an experiment to study the effects of 2 different diets (High and Low fat contents) on the weight gain and blood cholesterol levels of rats. Suppose that we find that there is an effect of the High vs. Low fat diets on bodyweight gain and on cholesterol levels. Then our researcher asks the question "Well, what is the correlation between weight gain and cholesterol level?" If we simply correlate the weight gain and cholesterol levels we will almost certainly get the WRONG answer for our correlation.

Steel, Torrie and Dickey, Chapter 14.6, and Chapter 11