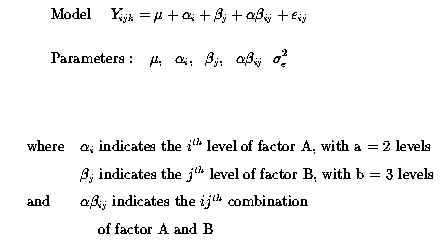
Factorial experiments arise when we have 2 or more factors with multiple measurements for each combination of factors. See Steel, Torrie and Dickey, Chapter 15.
Example with animals
An example with animals will be considered. Let us consider this in the context of a study of the effects of various diets on the growth of rats. We have 3 diets (1, 2 and 3), factor A, and 2 sexes (1 = Male and 2 = Female), factor B. We think that the effects of the 3 diets may not be the same in males and in females; i.e. an interaction between Diet and Sex. This is a 3 x 2 factorial design, similar to the example given below for plants. For each of the 6 combinations we decide to use 4 experimental units (i.e. 4 animals, each in seperate cages). Therefore we require 24 cages (12 males and 12 females; 1 rat per cage). The 12 males must be a random sample from available males and must be assigned to the 3 diets (1, 2 and 3) at random; similarly for the females.
Note, in the table below the first letter refers to Sex, (1 = Male) or (2 = Female), the second letter refers to the Diet (1, 2 or 3); the number refers to whether it is the first, second, third or fourth experimental unit for the given combination. Thus the 3 character indicator serves to designate any particular observation.
| Y112, Y=104 | Y223, Y=103 | Y123, Y=91 | Y131, Y=94 | Y133, Y=92 | Y222, Y=104 |
| Y111, Y=104 | Y134, Y=93 | Y233, Y=92 | Y213, Y=101 | Y224, Y=104 | Y234, Y=89 |
| Y214, Y=105 | Y113, Y=107 | Y124, Y=93 | Y121, Y=99 | Y212, Y=102 | Y221, Y=98 |
| Y232, Y=91 | Y132, Y=86 | Y211, Y=101 | Y122, Y=97 | Y114, Y=106 | Y231, Y=86 |
Example with crops/plants
An example with crops will serve to illustrate the basic concept. Suppose that we are interested in looking at 2 factors (Phosphorus and Nitrogen) and their effect on maize yield. We are going to use 2 'levels' of Phosphorus (1 = High = 150kg, and 2 = Low = 50kg), factor A, and 3 'levels' of Nitrogen (1 = High = 200kg, 2 = Medium = 150kg, and 3 = Low = 100kg), factor B. This is a 3 x 2 factorial. For each of the 6 combinations we decide to use 4 experimental plots; for a total of 24 (3 x 2 x 4) plots. The plots are the experimental unit and must be assigned to the treatment combinations at random.
Note the first letter refers to Phosphorus (High or Low) and the second refers to Nitrogen (High, Medium or Low); the number indicates whether it is the first, second, third or fourth experimental unit for the given combination. Thus the 3 character indicator serves to designate any particular observation.
| Y112, Y=104 | Y223, Y=103 | Y123, Y=91 | Y131, Y=94 | Y133, Y=92 | Y222, Y=104 |
| Y111, Y=104 | Y134, Y=93 | Y233, Y=92 | Y213, Y=101 | Y224, Y=104 | Y234, Y=89 |
| Y214, Y=105 | Y113, Y=107 | Y124, Y=93 | Y121, Y=99 | Y212, Y=102 | Y221, Y=98 |
| Y232, Y=91 | Y132, Y=86 | Y211, Y=101 | Y122, Y=97 | Y114, Y=106 | Y231, Y=86 |
Then the linear model will be
Yijk = µ + Ai + Bj + ABij + eijk
This is a fixed effects model; we are interested in the fixed, specific levels of the factors A and B that we chose to consider. These results are not extrapolatable to other 'levels' of A or B, or even to intermediate amounts, i.e. 105 kg Nitrogen.
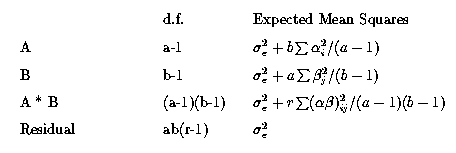
Then the Expected Mean Squares from the Analysis of Variance are :
![]() Run this model and examine the output. Verify the Normal Equations,
the fitted values and the contrast statements (specifically the implicit
k' matrix printed by the /e option).
Run this model and examine the output. Verify the Normal Equations,
the fitted values and the contrast statements (specifically the implicit
k' matrix printed by the /e option).
The fitted value for A1, B1 is :
![]()
With k' matrix
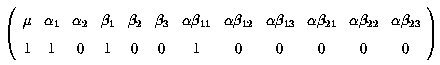
Thus the fitted values for factor A and their k' matrices are :
Fitted value = µ + a1 + b1 + ab11
k' =
Fitted value = µ + a1 + b2 + ab12
k' = 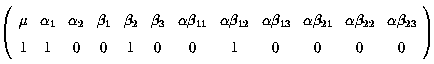
Fitted value = µ + a1 + b3 + ab13
k' = 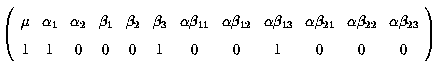
Fitted value = µ + a2 + b1 + ab21
k' = 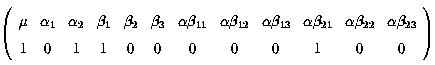
Fitted value = µ + a2 + b2 + ab22
k' = 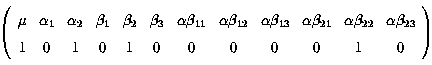
Fitted value = µ + a2 + b3 + ab23
k' = 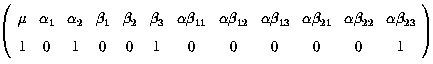
Thus the contrast between factor A1 and A2 is
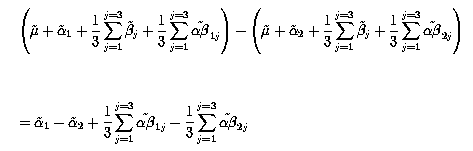
With k' matrix = ![]()
![]() Verify these algebraic computations and the numerical results. Compare them
to the SAS output and check that with the k' matrix you obtain the Type III,
Marginal, Sums of Squares for factor A (Phosphorus or Sex).
Verify these algebraic computations and the numerical results. Compare them
to the SAS output and check that with the k' matrix you obtain the Type III,
Marginal, Sums of Squares for factor A (Phosphorus or Sex).
Note particularly that the Sums of Squares for factor A is thus adjusted for factor B, and for the (un)equal frequency of observations in each AB subclass, but does include interaction effects, i.e. SSA = R( A | µ, B)
![]() Repeat this same exercise for factor B (Nitrogen or Diet) fitted values
and differences to ensure that again the k' matrix generated gives the
Type III, Marginal, Sums of Squares for the effect of factor B (Nitrogen
or Diets).
Repeat this same exercise for factor B (Nitrogen or Diet) fitted values
and differences to ensure that again the k' matrix generated gives the
Type III, Marginal, Sums of Squares for the effect of factor B (Nitrogen
or Diets).
Again, note that the Sums of Squares for factor B = R( B | µ, A).
Note that although we are computing Sums of Squares, as well as linear functions of fitted values, for factor A adjusted for factor B, and vice versa, we are not able to adjust out completely the interaction components! We can account for unequal frequencies but we are unable to completely remove the interaction effects, as noted by their presence in the k` matrices.
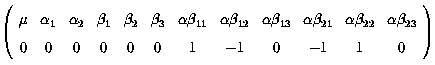
For the Sums of Squares for the Interaction we have to remember that the Interaction measures whether the differences between factor A levels are the same at each level of factor B; i.e. the differences of the differences.
![]() measures the
difference factor A level 1 - 2 at level 1 of factor B.
measures the
difference factor A level 1 - 2 at level 1 of factor B.
Similarly
![]() measures the
difference factor A level 1 - 2 at level 2 of factor B.
measures the
difference factor A level 1 - 2 at level 2 of factor B.
Thus the difference between these 2 differences measures the difference in
the differences between factor A 1 - 2 at level 1 and level 2 of factor B :
![]()
A suitable k' matrix would be :
Similarly
![]() measures the
difference between level 1 - 2 of factor A at level 3 of factor B.
measures the
difference between level 1 - 2 of factor A at level 3 of factor B.
Thus the difference between these 2 differences measures the difference in
the differences between level 1 - 2 of factor A at level 1 and level 3 of
factor B :
![]()
A suitable k' matrix would be :
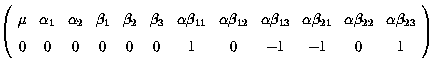
Therefore we have 2 contrasts,
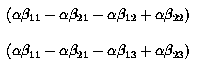
This measures the Interaction component. Note that the 2 contrasts involve only interaction components, thus the interaction component is free of main effects, i.e. it is R(AB | µ, A, B).
![]() Construct a suitable k' matrix
(of 2 rows)
involving these 2 contrasts that will enable us to compute the Sums of
Squares for the interaction effect.
Construct a suitable k' matrix
(of 2 rows)
involving these 2 contrasts that will enable us to compute the Sums of
Squares for the interaction effect.
Use this contrast in PROC GLM to compute the Sums of Squares and verify that they equal those in the following ANOVA table.
| Source of variation | d.f. | Sums Squares | Mean Squares | F-ratio | Pr |
|---|---|---|---|---|---|
| SSRm | 5 | 857.833 | 191.567 | 24.28 | .0001 |
| A | 1 | 4.167 | 4.167 | 0.53 | .47 |
| B | 2 | 728.583 | 364.292 | 46.18 | .0001 |
| A * B | 2 | 125.083 | 62.542 | 7.93 | .0034 |
| Residual | 18 | 142.00 | 7.89 |
If the interaction term is statistically significant what does this mean?
It means that the interaction term AB is presumed to be real and to exist; that the model cannot be simply explained in terms of µ, A and B (see Ch 15.1 and Ch 15.2 of Steel, Torrie and Dickey). Thus our fitted values are :
![]()
Looking at these estimable functions we can see that there is no way to obtain only differences between levels of a main effect completely free of other effects; i.e. (A1 - A2) is not estimable.
![]() Why? An exercise. Write down algebraically all, each and every fitted value
(estimated value).
Why? An exercise. Write down algebraically all, each and every fitted value
(estimated value).
We must consider what are sometimes called 'Simple Effects'.
Simple effects are 'simply' (sic) the fitted values, i.e.
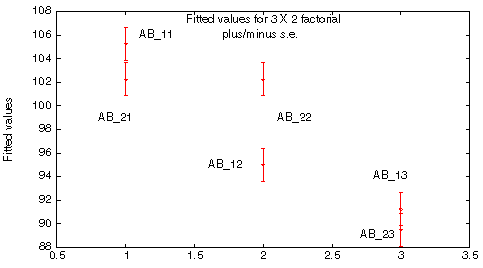
There are 6 fitted values in this example for the 'simple effects'.
![]()
| Simple effects | Estimate ± s.e. |
|---|---|
| µ + a1 + b1 + ab11 | 105.25 ± 1.40 |
| µ + a1 + b2 + ab12 | 95.00 ± 1.40 |
| µ + a1 + b3 + ab13 | 91.25 ± 1.40 |
| µ + a2 + b1 + ab21 | 102.25 ± 1.40 |
| µ + a2 + b2 + ab22 | 102.25 ± 1.40 |
| µ + a2 + b3 + ab23 | 89.50 ± 1.40 |
![]() An exercise. Plot the fitted values (on the Y-axis) against diet (as 1, 2
and 3 on the X-axis) for both males and females,
Graph. Estimate ( ± s.e.) the
differences between males and females on each of the 3 diets.
An exercise. Plot the fitted values (on the Y-axis) against diet (as 1, 2
and 3 on the X-axis) for both males and females,
Graph. Estimate ( ± s.e.) the
differences between males and females on each of the 3 diets.
What if we think that the variability in the different groups varies. i.e. that the variances in the various subclasses (Factor A * Factor B subgroups) are not homogeneous? Check back in the section Normality and Homogeneity of Variance. Does this give you any ideas how to tackle and answer this question? Jump to this section for more details on the actual SAS code for this problem, answer and discussion.
Here is another example, with unequal numbers of observations. Repeat the above exercises and construct the Analysis of Variance table and compute the fitted values.
SAS code, PROC GLM , example with unequal numbers of observations.

