See also Experimental Design, Cochran and Cox, Chapter 4
This is one of the simplist classification designs; quite robust, easy to use and analyse.
Consider that we have 6 diets to feed to dairy cows and we wish to determine which one provides the most milk. We have a group of 30 cows, assumed to be similar, but not necessarily identical, and to be a representative random sample of dairy cows, typical of this region. We assign the cows to the 6 treatments/diets at random. Each cow is in her own tie-stall, so that they cannot poach (steal) from oneanother, and fed individually. This is important; if we had the 5 cows on Diet 1 in a single group and fed as a group then the experimental unit would be the group, and not the individual cow; this is true even if we milk the cows individually - the experimental unit is the group, the cows are the sampling unit. We record the cumulative milk yield for each cow for a month and record the average yield for each.
Unfortunately, for reasons quite beyond our control and unrelated to the diet, 1 cow from each of the Diets 2 and 3 are removed from the trial (perhaps a reproductive biologist 'appropriates' these cows for his, or her, own trial).
| Diet 1 | Diet 2 | Diet 3 | Diet 4 | Diet 5 | Diet 6 |
|---|---|---|---|---|---|
| 19.4 | 17.7 | 17.0 | 20.7 | 14.3 | 17.3 |
| 32.6 | 24.8 | 19.4 | 21.0 | 14.4 | 19.4 |
| 27.0 | 27.9 | 9.1 | 20.5 | 11.8 | 19.1 |
| 32.1 | 25.2 | 11.9 | 18.8 | 11.6 | 16.9 |
| 33.0 | . | . | 18.6 | 14.2 | 20.8 |
Consider a similar example involving plants. We have 6 treatments (inoculants) to apply to red clover plants. There are thirty (30) individual plots available to us to use; we randomly assign 5 plots to each of the 6 treatments. N.B. this random assignment is VERY important; if we simply assigned the five plots in row 1 to be assigned to treatment 1, and then the 5 plots in row 2 to be assinged to another treatment (perhaps treatment 6), and then the 5 plots in the third row to another treatment (perhaps treatment 5), etc then this would ABSOLUTELY NOT count as a random assignment at we would not have a valid analysis, only a bad example! Assuming a random assignment, at the end of the growing season we measure the nitrogen content of the plants. We started with 30 plants, randomly assigning 5 of the plants to each of the 6 treatments.
Unfortunately, for reasons unrelated to the inoculants we are missing 2 observations; perhaps during the laboratory analysis for the nitrogen content the machine broke down and these two samples were lost.
| 3DOk1 | 3DOk5 | 3DOk4 | 3DOk7 | 3DOk13 | composite |
|---|---|---|---|---|---|
| 19.4 | 17.7 | 17.0 | 20.7 | 14.3 | 17.3 |
| 32.6 | 24.8 | 19.4 | 21.0 | 14.4 | 19.4 |
| 27.0 | 27.9 | 9.1 | 20.5 | 11.8 | 19.1 |
| 32.1 | 25.2 | 11.9 | 18.8 | 11.6 | 16.9 |
| 33.0 | . | . | 18.6 | 14.2 | 20.8 |
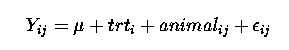
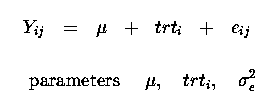
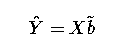
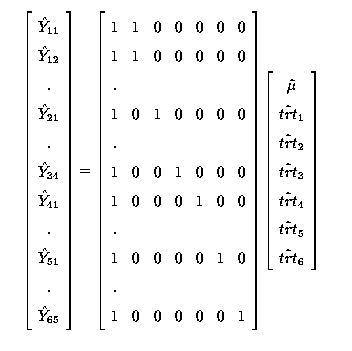
In this experimental design, and hence analysis, we consider that cows (plants) are a random sample from their respective populations and are assigned to treatments at random. Thus animals are a random effect, as is the measurement made on the cow (plant). Therefore a suitable linear model could be :
Yij = µ + trti + animalij + eij
as before for our regression problems, with only 1 observation per animal (plant) we cannot seperate animalij and eij effects, they are 'confounded' or combined into one error term, eij.
Thus our linear model now becomes :
See Course Notes, Section 1-Way Classification for more details about the Normal Equations, a generalised inverse and a solution vector.
SAS code for Data step, PROC GLM and IML
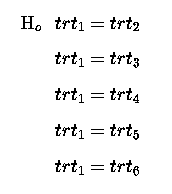
If we look at the ANOVA table below we can see that there are 5 degrees of freedom for the Model after µ ; there are 6 treatments so why are there only 5 degrees of freedom for treatment (the Model over and above the Mean)? Our null hypothesis with respect to treatments is that they are all the same, i.e.
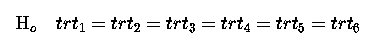
This we can rewrite as a series of single comparisons:
Which if we re-write so that the null hypothesis for each is = Zero, then we have:
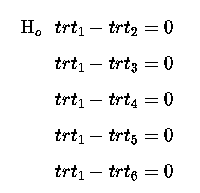
This gives us 5 comparisons, and hence the 5 degrees of freedom for our 6 treatments.
Our general formula for computing Sums of Squares is :
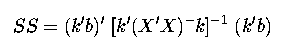
thus 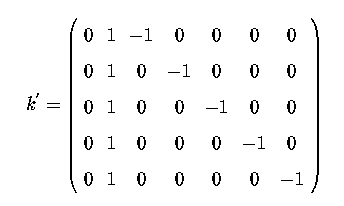
This therefore gives us our usual Analysis of Variance
| Source of variation | d.f. | Sums of Squares | Mean Squares | F-ratio | Prob. |
|---|---|---|---|---|---|
| Total | N = 28 | 12154.23 | |||
| Model | r(X) = 6 | 11873.112 | 1978.852 | 154.864 | |
| C.F. mean | 1 | 11060.437 | 11060.437 | 865.584 | |
| Model after µ | r(X)-1 = 5 | 812.675 | 162.535 | 12.720 | .0001 |
| Residual | N-r(X) = 22 | 281.118 | 12.778 |
thus
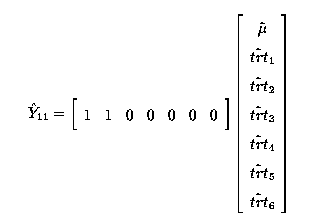
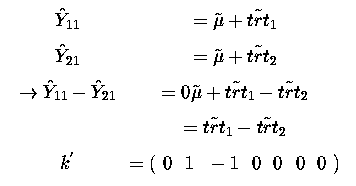
Any linear combination of fitted values must be estimable. So
 is estimable; it is a linear function
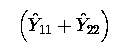
(the sum) of 2 fitted values,
is estimable; it is a linear function
(the sum) of 2 fitted values, 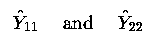 .
.
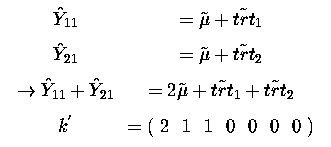
One might ask why would we want to take the sum of these two effects. Well we can then take the average of them, since it is still an estimable function. Perhaps these two treatments come from the same company and we want to know what their average effect is!
thus 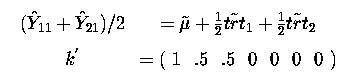
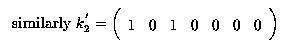
Similarly, the difference between is estimable.
If we look at the SAS estimate and contrast statements we find that they are closely tied to this aspect of estimability and our matrix k'.
In our SAS model we wrote
model y = trt;
the intercept, or mean µ , is implicit in the right-hand side of the equation
So k' = ( 0 1 -1 0 0 0 0 )
with SAS each section of the k' matrix is considered seperately as being 'named' by the effect in the model. In the above example k' matrix, the section pertaining to the effects of treatments (trt) is named by 'trt'. Thus we can use the estimate statement
estimate 'label' trt 1 -1 0 0 0 0;
the 'label' is simply a short identifier character string to indicate on the output which/what estimate. The trt specifies that we are describing the trt effects, which is why there are 6 coefficients,1 -1 0 0 0 0.
Note that we have not had to specify a leading 0 as we did for our explicit k' matrix. The leading zero pertains to the intercept/mean and not to treatments so we do not include it in the coefficients relating to trt.
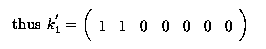
To estimate 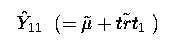 our k' matrix was
( 1 1 0 0 0 0 0 )
The appropriate SAS estimate statement is
estimate ' mu + trt 1' intercept 1 trt 1 0 0 0 0 0;
This illustrates how we can specify the intercept (mean) as well as the coefficients for trt.
It is most important to clearly understand that SAS checks the estimate statement to ensure that it is a linear function of fitted values and hence is estimable. This means that we cannot simply write any coefficients in the estimate statement and expect SAS to compute an answer. For example, if we think that it would be nice to estimate the effect of treatment 1 we might write:
estimate ' trt 1' trt 1 0 0 0 0 0;
if we run this SAS will check and determine that it is non-estimable since it is impossible to obtain the effect of treatment 1 only as a linear function of the fitted values. SAS will say that it is non-estimable and will not compute any value. SAS is very strict with respect to checking for estimability. If it is estimable it is estimable; if it is not estimable it is not estimable and there is nothing that one can do to convince SAS otherwise!
The k' matrix is used to compute fitted values and estimable values (k'b) and also to provide the sampling variances (and standard errors) of such estimates:
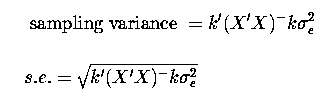
The SAS estimate statement provides not only the estimate, but also the
standard error of the estimate. In the case of a simple One-Way ANOVA,
a Completely Randomised Design (CRD), the
sampling variance 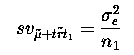 where n_1 is the number
of observations for treatment 1 (n_1 = 5 in our case). However, for more
complicated designs there are no such simple formulae; but we can
always use our matrix k', both to estimate any estimable effect and to compute
it's sampling variance and hence it's standard error.
where n_1 is the number
of observations for treatment 1 (n_1 = 5 in our case). However, for more
complicated designs there are no such simple formulae; but we can
always use our matrix k', both to estimate any estimable effect and to compute
it's sampling variance and hence it's standard error.
| Treatment | Estimate | Standard Error |
|---|---|---|
| µ + trt1 | 28.82 | 1.60 |
| µ + trt2 | 23.90 | 1.79 |
| µ + trt3 | 14.35 | 1.79 |
| µ + trt4 | 19.92 | 1.60 |
| µ + trt5 | 13.26 | 1.60 |
| µ + trt6 | 18.70 | 1.60 |
Note the larger standard errors for treatments 2 and 3, which had fewer observations.
 Construct a k' vector to compute a fitted value
for an observation from treatment 1. Repeat this for each treatment.
Construct a k' vector to compute a fitted value
for an observation from treatment 1. Repeat this for each treatment.
Using the k' vectors you have computed verify that, when multiplied by the solution vector, you obtain the same fitted values and standard errors as in the table above.
Building on the k' vectors you have computed,
construct a k' vector to
estimate the difference (treatment 1 - treatment 2). Now compute this
estimate and its standard error. Compare your answer with that obtained
from the SAS analysis. Pay particular note to the /e option from
the estimate command in SAS from the first estimate of differences amongst
treatments.
Construct a k' vector for each of the contrasts :
| treatment 1 - treatment 2 |
|---|
| treatment 1 - treatment 3 |
| treatment 1 - treatment 4 |
| treatment 1 - treatment 5 |
| treatment 1 - treatment 6 |
Combine these into one matrix of 5 rows. Using the general formula for computing Sums of Squares:
calculate the Sums of Squares of these 5 linearly independent contrast. Note that these are the Sums of Squares for treatments, i.e. R(trt | µ).
SAS code for PROC GLM, after the model statement

contrast 'treatments' trt 1 -1 0 0 0 0,
                      trt 1 0 -1 0 0 0,
                      trt 1 0 0 -1 0 0,
                      trt 1 0 0 0 -1 0,
                      trt 1 0 0 0 0 -1;
Find 5 other sets of 5 linearly independent contrasts. Verify that they all compute the same thing, R(trt | µ).
Compare Diet 6 to the average of the other 5 diets. Estimate the difference and also test this using an F-test.

